


A new national air quality forecast will help people with asthma plan their days better, the Environmental Protection Agency has said.
The forecast will be updated several times a day and will span across three days; today, tomorrow and the day after tomorrow.
The interactive map will let people pinpoint air quality within 9km2 of where they are.
It'll include the daily Air Quality Index for Health (AQIH), Particulate Matter (PM), nitrogen dioxide (NO2) and ozone (O3) forecasts.
All areas will range in colour from green (good) through to purple (very poor).
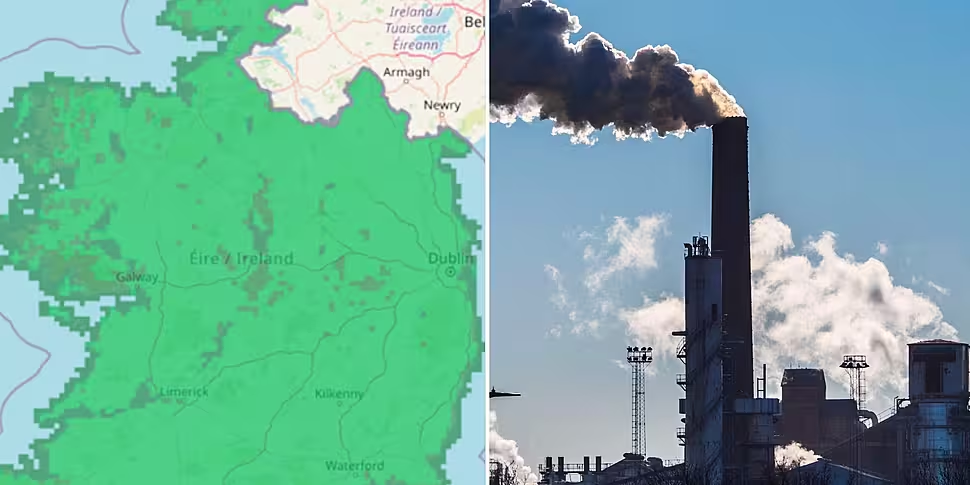
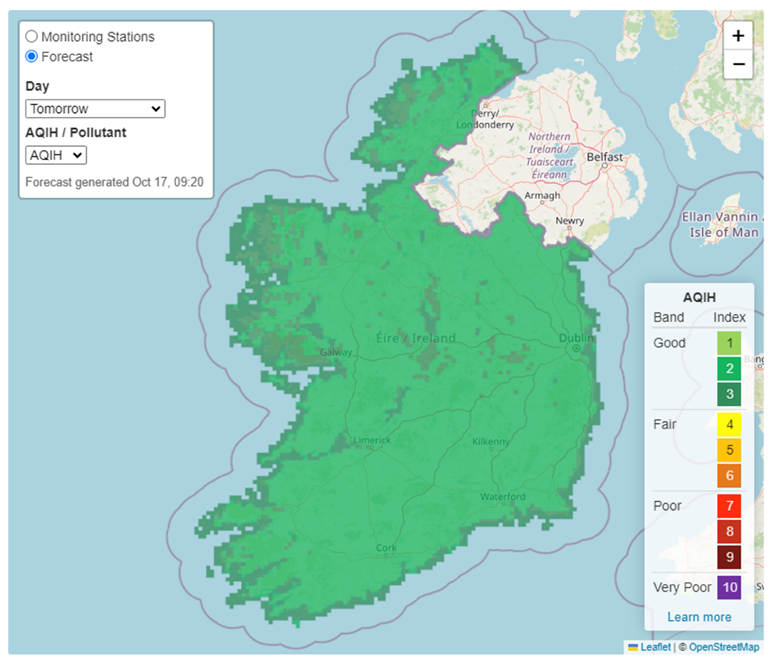 An example of the EPA Air Quality Map. Image: EPA
EPA Senior Scientist Patrick Kenny told Newstalk Breakfast the map is very detailed.
"You can go in and take a look at what the air quality is predicted to be across your local area for today, tomorrow and the day after tomorrow," he said.
"It's updated twice daily in the morning time and the evening time.
"It relays that information about predicted air quality as the Air Quality Index for Health.
"So, it takes the basket of pollutants that we're forecasting for and it converts those to a colour-coded map across Ireland.
"You can zoom in on that map down to a 3x3km2 across your local area."
'Colder, stiller evenings'
Mr Kenny said the air quality will likely get worse as we head into winter.
"As we're moving now into the winter heating season and we're getting those colder, stiller evenings we're going to see the forecast and indeed our monitoring network... shift to a poor to very poor status at different points during the winter," he said.
"For air quality to be poor in a given area, the air pollutants have to be there in the first place," he said.
"Equally when that is then added to by unfavourable weather conditions, particularly cold, still air where pollutants don't disperse... we do then see... those colours across that map will start to shift from the greens."
'Optimum days'
Mr Kenny said the forecast will be particularly useful for those with asthma, heart conditions or other conditions impacted on by poor air quality.
"They can look at this forecast... and look to plan their activates on the basis of what the air quality is predicted to be in their local area.
"Be that going for a jog or as simple as going for a trip down to the shops, they can look to see what is the optimum days in the days going forward to do those activities," he added.
Listen back here:


